All case studies

Case study · A global pharmaceutical company

From busy work to resource intelligence.

A digital diagnostics team inside a global pharmaceutical company was investing roughly $50M a year across five teams. The plans were real, and the commitment was real. What nobody could prove was whether the funded plan was where the capacity was actually going.

Digital diagnostics · Healthcare. The client is described, not named, by agreement.

20% → 93%
Work aligned to the funded plan, within one quarter
10,000
Jira tickets analyzed to map where effort was really going
$50M
Annual digital investment across five teams
~$35M
Potential swing in focus, from reactive work toward the funded plan

The problem: a plan that capacity was not following

On paper, the operating rhythm looked disciplined. Quarterly plans were set, roadmaps published, ceremonies held, and the work carried real weight: products and capabilities with implications for affiliates, commercial teams, and ultimately patients. Underneath that structure, the execution data told a different story.

Only about 20% of planned quarterly work was getting completed. The reason was not effort or talent. Only about 20% of the team's capacity was going to the plan in the first place. The remaining 80% was absorbed by work that never appeared in any plan: stakeholder requests, urgent escalations, pressure from affiliates in the field, and reactive demands that arrived faster than a roadmap could absorb them.

A second problem sat underneath the first. Even a perfectly executed plan can be the wrong plan. The team's strategic goals lived in a deck of more than 50 pages, disconnected from the systems where work happened. Some goals were not being measured at all. Others could not yet be measured cleanly. Leadership faced two unknowns at once: whether the team was executing the plan, and whether the plan deserved the execution.

What we did: one view of strategy, work, and capacity

Iteright started with execution reality rather than the strategy deck. We analyzed the team's work across 10,000 Jira tickets and mapped where effort was actually going, team by team, against the funded plan. The gap stopped being a suspicion argued about in meetings and became a number leadership could see.

Then we configured Iteright as the team's operating system. Strategy, opportunities, execution activity, resources, and impact measurement were connected in one live view, so a decision made in a planning meeting stayed visible all the way down to the tickets doing the work, and back up to the outcomes that work was supposed to produce.

93%
of work aligned to the funded plan within one quarter, up from one fifth at the first Snapshot.

How we did it: better bets, honestly measured

Execution focus alone would only have made the team better at executing the wrong plan faster. So the opportunity process changed too. Signal from affiliates in the field, the people closest to customers and adoption barriers, was structured into opportunity evaluation alongside business goals, engineering feasibility, and expected commercial impact. Before a bet absorbed major capacity, it had to be validated, aligned to strategy, modeled for impact, and de-risked.

The goals themselves came out of the deck and into the system. Each strategic goal was articulated with its key impact metrics and connected to the work meant to move it. Where a metric could not yet be measured cleanly, the system said so. The team worked from a measurement maturity view: what can be measured now, what is projected, what needs a manual update, and what has to mature next. Honest numbers, improving on a visible path.

The outcome: 93% of work on the funded plan

Within one quarter, work aligned to the funded plan rose from 20% to 93%. On roughly $50M of annual digital investment, a swing of that size represents a potential $35M of capacity redirected from scattered, reactive work toward the initiatives leadership had actually chosen. The point is not newfound profit. The point is that an investment the company was already making started going where the company had decided it should go.

Just as valuable was the story leadership could now tell with confidence: what we are betting on, why we chose it, how much effort is going there, how execution is tracking, what impact we expect, and what we can measure today. Those are the questions every product leader in a complex organization has to answer. This team answers them from one view.
The mechanism, in detail

How it worked: tickets to plan to strategy

Most alignment work starts at the top, with the strategy deck, and pushes down. This engagement ran in the opposite direction. We started with the work itself and traced it upward: ticket to funded initiative, initiative to plan, plan to the strategy the work was supposed to serve. Anything that could not be traced was named and counted, not assumed away.

  1. Ingest the work as it actually was

    The execution record came first: 10,000 Jira tickets across the five teams, pulled into Iteright and normalized against the roadmaps and the funded plan the teams were already working to. No sampling, and no self-reported estimates. The full inventory, taken from the system where the work actually happened.

  2. Match every ticket to the plan, in days

    Because Iteright holds both sides of the comparison, the roadmap and the tickets, connecting the dots was fast: the matching ran in days, not in a consulting quarter. Each ticket was matched to the funded initiative it served. A ticket that matched counted as planned work. A ticket that matched nothing was flagged as unplanned demand and kept visible in its own category, instead of hiding inside a team's totals where nobody would ever question it.

  3. Score alignment team by team

    Alignment was scored per team rather than as one portfolio average, and that choice mattered. The average hid the story: some teams were largely on plan, while others were carrying heavy reactive loads from stakeholder requests and escalations, and their scores said so plainly. Across the full inventory, AI agents surfaced the patterns and themes no one reads 10,000 tickets to find, and helped formalize what the inventory actually meant. Where the record had gaps, we worked through a short list of questions with the team and filled them quickly, so the picture that reached leadership was the whole picture.

  4. Put the unaligned share in front of leadership

    The reallocation conversation ran off the matched data. For each team, leadership could see what the unplanned work was, where it came from, and what it was displacing. Then came the decisions: stop some of it, schedule some of it honestly, or adopt it into the plan where it genuinely belonged.

  5. Re-measure the next quarter

    The same matching ran again on the following quarter's tickets, under the same rules. Work aligned to the funded plan had risen from 20% to 93%. Because the method never changed between measurements, the improvement could not be argued away as a friendlier definition.

The direction of travel

10,000 Jira tickets

The execution record across five teams

Funded plan

Each ticket matched to the initiative it serves

Alignment score

Planned and unplanned work, scored per team

Strategy

Every initiative traced to the goal it funds

Read left to right: from the work, up to the strategy. Work that matched nothing stayed visible as its own category at every step.

Before and after, by the numbers

MeasureFirst SnapshotOne quarter later
Work aligned to the funded plan20%93%
Work traced to no funded initiative80%7%
Ticket inventory analyzed10,000 ticketsFull inventory, same method
Teams covered55
Annual investment in scope~$50M~$50M

The method stayed fixed between the two measurements, so the columns compare directly.

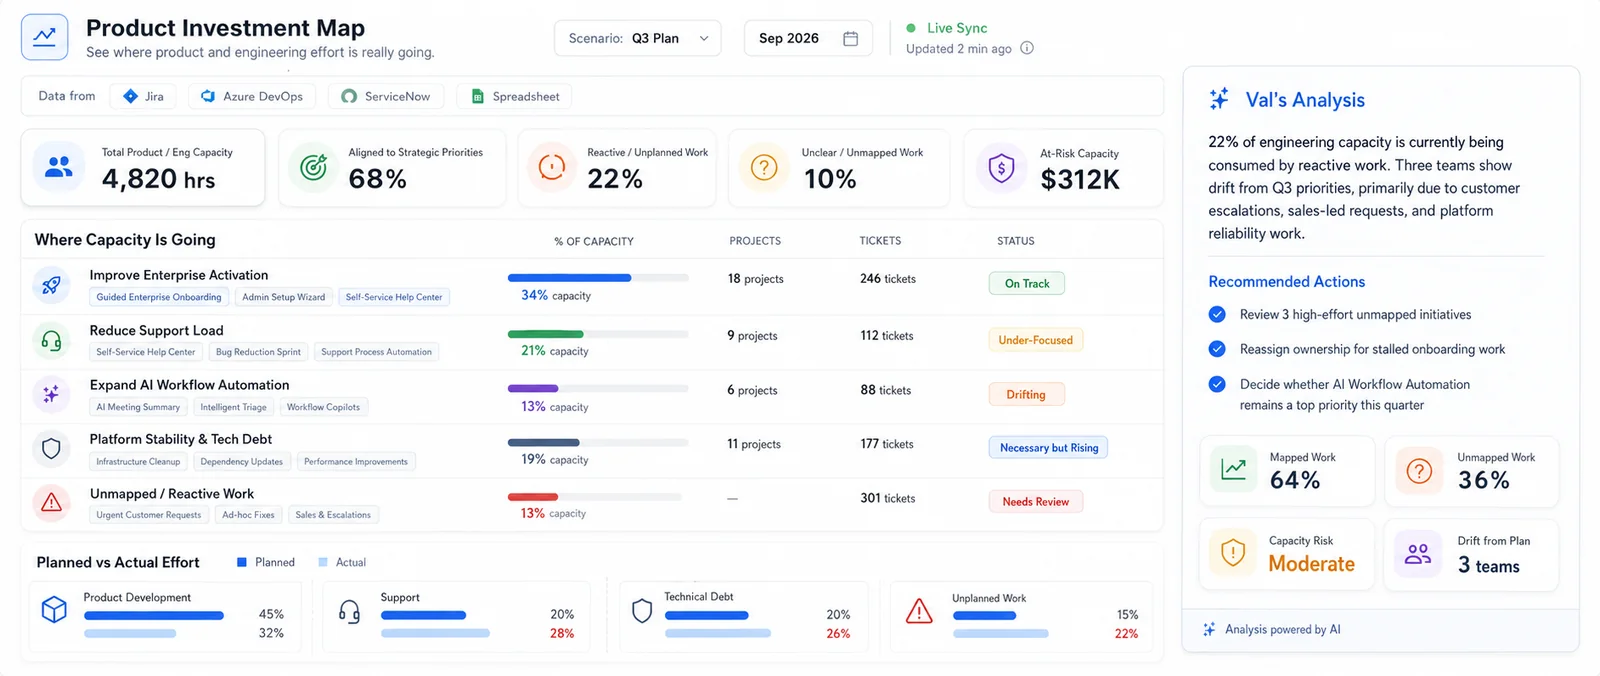
Iteright product view of an investment map showing where team capacity is going across initiatives, with planned and unplanned work separated
The investment map: every ticket traced to the initiative it serves, with unplanned work named as its own category. Product view, shown with demonstration data.
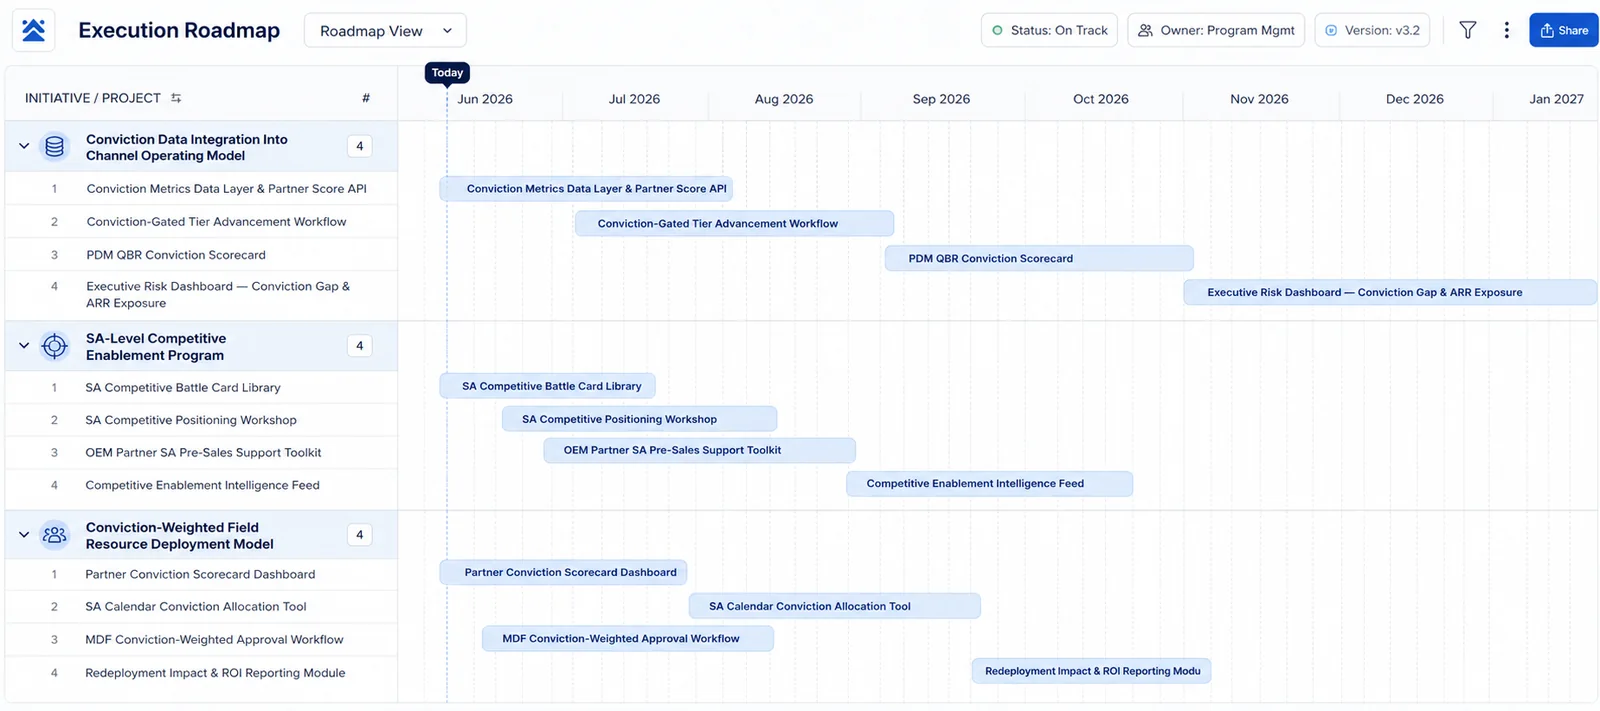
Iteright product view of an execution roadmap with initiatives and the projects under them laid out across quarters
The plan layer once the matching is done: initiatives and the projects under them, in one roadmap leadership can read. Product view, shown with demonstration data.

What the unaligned work actually was

Read as one body of work, the unmatched share had a recognizable shape. It was heavily engineering work: performance fixes, infrastructure upgrades, support work, items driven by customer feedback, small bug fixes, and little optimizations. Much of it was legitimate. The problem was never that the work was worthless. The problem was that nobody had chosen it against the plan, so it competed with the funded initiatives on equal terms, and usually won, because it arrived loudest.

Two patterns stood out once the inventory was read whole. The first was duplicate work: the same item versioned and re-versioned, reworked again even when it was already in a good spot. The second was a long tail of UX updates, each one small, collectively large. Neither pattern is visible ticket by ticket. Both are obvious the moment 10,000 tickets are read as a single body of work, which is what the matching made possible.

Why the plan kept not finishing

The organization planned on the Scaled Agile Framework: every three months, a detailed plan, worked out down to the feature level, and then the same exercise again the following quarter. The plans were clear. They also never finished, and the standing question was why. Real life inside the quarter supplied the answer the planning event could not: the plan was not failing when it was made. It was being displaced, item by item, as random demands arrived and urgent work pushed planned work aside.

What the data gave the teams was awareness with evidence behind it: a clear view of what they were really doing, set against what they had said they would do. That view made it possible to say no to incoming work, and to say it as a decision rather than a reflex. Random things will always come up inside a three-month plan, and pushing some of them away is fine. The difference is understanding, at the moment the choice is made, what accepting one thing does to the initial plan. Displacement became a trade the teams could see, price, and choose, instead of a surprise they discovered at the next planning event.

What moved the number was not a new plan. The plan barely changed. What changed is that unplanned work became a decision instead of a default: it had to be stopped, scheduled, or adopted on purpose. Once incoming demand had to argue for its place, the funded plan started winning the argument.

Free. No Credit Card. No Prep. No Commitment.

Your Free Strategy Execution Snapshot.

Bring what you have. Leave with a clearer picture and a concrete plan.

Free.

No credit card · No prep · No commitment

Bring what you already have

Bring your roadmap, tickets, strategy notes, Jira or ADO export, Linear board, spreadsheet, or even a rough list of priorities. No cleanup, integrations, or long onboarding required — we do the work to turn what you already have into a clear picture of where effort is going, what is aligned, where things have drifted, and exactly what to do next.

  • Roadmap or strategy doc
  • Jira, ADO, or Linear export
  • Backlog or ticket list
  • ServiceNow demands
  • Spreadsheet or rough list of ideas

What you walk away with

  • Strategy-to-Execution Map

    See how goals, roadmap, initiatives, and active work connect.

  • Work Focus & Drift View

    Understand where effort is going and what may be drifting from the plan.

  • Opportunity Decision View

    Know what to build, pause, clarify, validate, or measure next.

  • Outcome & Next Moves Summary

    Get the outcomes, measurement gaps, and 3–5 recommended next moves.

Get your free Strategy Snapshot

Bring anything. We do the work. You'll leave with more clarity either way.

Used by VP Products, GMs, strategy leaders, and founders at companies from growth-stage startups to billion-dollar organizations.