All case studies

Case study · A U.S. national research laboratory

A governance layer above the tools the laboratory already runs.

A U.S. national research laboratory with thousands of employees was standardizing on ServiceNow as the place work should live. Leadership still could not see what work was happening, how it connected to strategy, or what value it produced.

Digital transformation · Federal research. The client is described, not named, by agreement.

180%
Team capacity allocation surfaced by the first Snapshot
6
Systems holding fragments of the truth, from ServiceNow to spreadsheets
90 days
To prove the operating model inside one division
1 → 10
Transformation teams in the expansion now underway

The problem: every system held part of the truth

The laboratory's new head of digital transformation owned a problem familiar to every large technology organization. ServiceNow was becoming the system where work was supposed to live, but teams also worked in Jira, Azure DevOps, GitLab, spreadsheets, and Power BI. Each tool held a fragment of the truth. None of them could produce a trusted view from idea to demand to project to product to feature to outcome.

The gaps compounded. ServiceNow's demand form is powerful but heavy, so early-stage ideas often never entered the system cleanly. Leadership reporting was assembled by hand from exports and dashboards, and it was stale by the time anyone reviewed it. Then a first Snapshot looked at real capacity and found teams allocated at 180%: the same scarce experts promised to nearly twice the work they could possibly deliver.

What we did: become the connective layer, not another replacement

Iteright did not ask the laboratory to rip anything out. The goal was the opposite: make ServiceNow and the execution tools more useful by surrounding them with the governance layer they were missing. Working with the transformation leader, we defined the operating model, ingested the messy demand and project data behind it, and separated ideas from demands from projects, three categories the existing systems blurred together.

The result is a live portfolio view leadership can actually use: what teams are working on, which work is planned and which is unplanned, how work maps to strategic priorities, and where teams are drifting from the plan they committed to.

180%
of capacity: the allocation the first Snapshot found, the same scarce experts promised to nearly twice the work they could deliver.

How we did it: start with application development governance

The first use case was deliberately concrete: application development governance. Iteright integrates with, or ingests exports from, ServiceNow and the execution tools, and adds the operating capabilities the stack lacked: lightweight idea intake that people will actually complete, structured validation, prioritization, roadmap alignment, and executive-ready reporting built from live data instead of hand-stitched summaries.

That gives leadership direct answers to questions they previously could not settle. What are teams actually working on? Which work should become a formal demand or project? How much capacity goes to planned work versus operational noise? Which initiatives align to strategic goals? And what should we stop, start, or accelerate?

The outcome: a Snapshot that became a production system

The entry point was a single Strategy Snapshot. Its findings were concrete, the 180% capacity picture chief among them, and the laboratory moved Iteright into production. The deployment is now expanding from one transformation team toward ten, following the arc set at the start: prove the model in one division in the first 90 days, then scale it across additional IT groups.

The trajectory points at something larger than one portfolio view: a standardized governance layer for the whole laboratory, a PMO-grade operating picture above the tools teams already use. Most large organizations already own ServiceNow, Jira, and a reporting stack. What they lack is the layer that connects those tools to strategy. That is the gap this deployment is closing.
The mechanism, in detail

How it worked: six systems, one governance layer

The laboratory did not have a tooling shortage. It had six systems that each told the truth about one slice of the work, and no layer above them where the slices became one picture. Iteright was deployed as that layer: connected to the tools the laboratory already runs, and a replacement for none of them.

  1. Inventory where the truth lived

    Work was spread across six kinds of system: portfolio records, delivery tools, the service platform where demand arrived, time tracking, finance, and the reporting tools where status was assembled by hand. Each held a fragment of the truth. None of them could answer a leadership question on its own.

  2. Connect the sources into one view

    Iteright ingested the demand and project data behind the operating model and connected it end to end: idea to demand to project to product to feature to outcome. The tools underneath stayed exactly where they were. What changed is that their data now meets in one place.

  3. Separate ideas, demands, and projects

    The existing systems blurred three different things into one queue. Iteright gives each its own path: lightweight intake that people will actually complete for early ideas, structured validation before an idea earns resources, and formal demands and projects once a decision has been made.

  4. Read the capacity truth

    The first Strategy Snapshot set the portfolio against real capacity and found teams allocated at 180%: the same scarce experts promised to nearly twice the work they could deliver. That single number did more than any roadmap to turn a pilot conversation into a deployment decision.

  5. Prove it in one team, then expand

    The operating model was proven inside one transformation team against real data, and the laboratory then moved Iteright into production. The deployment is now expanding from that one team toward ten, carrying the same model to each new group.

Six partial views, one governance picture

Portfolio

What was funded

Delivery

What teams are building

Service

What is being requested

Time

Where the hours actually go

Finance

What the work costs

Reporting

What leadership sees

One governance view

What is funded, what is running, and where work is drifting, answered from live data

The governance layer replaces none of the six. It connects them, so a question gets answered once, from data that is already there.

Before and after the governance layer

Leadership questionBeforeWith the layer in place
What are teams actually working on?Fragments across six systemsOne live portfolio view
How booked are the teams, really?Not measured against real capacityMeasured: 180% allocation at the first Snapshot
Where does leadership reporting come from?Exports stitched together by handReporting built from live data
How far has it spread?One team, one SnapshotProduction, expanding from one team toward ten

The before column describes the operating picture the first Snapshot found.

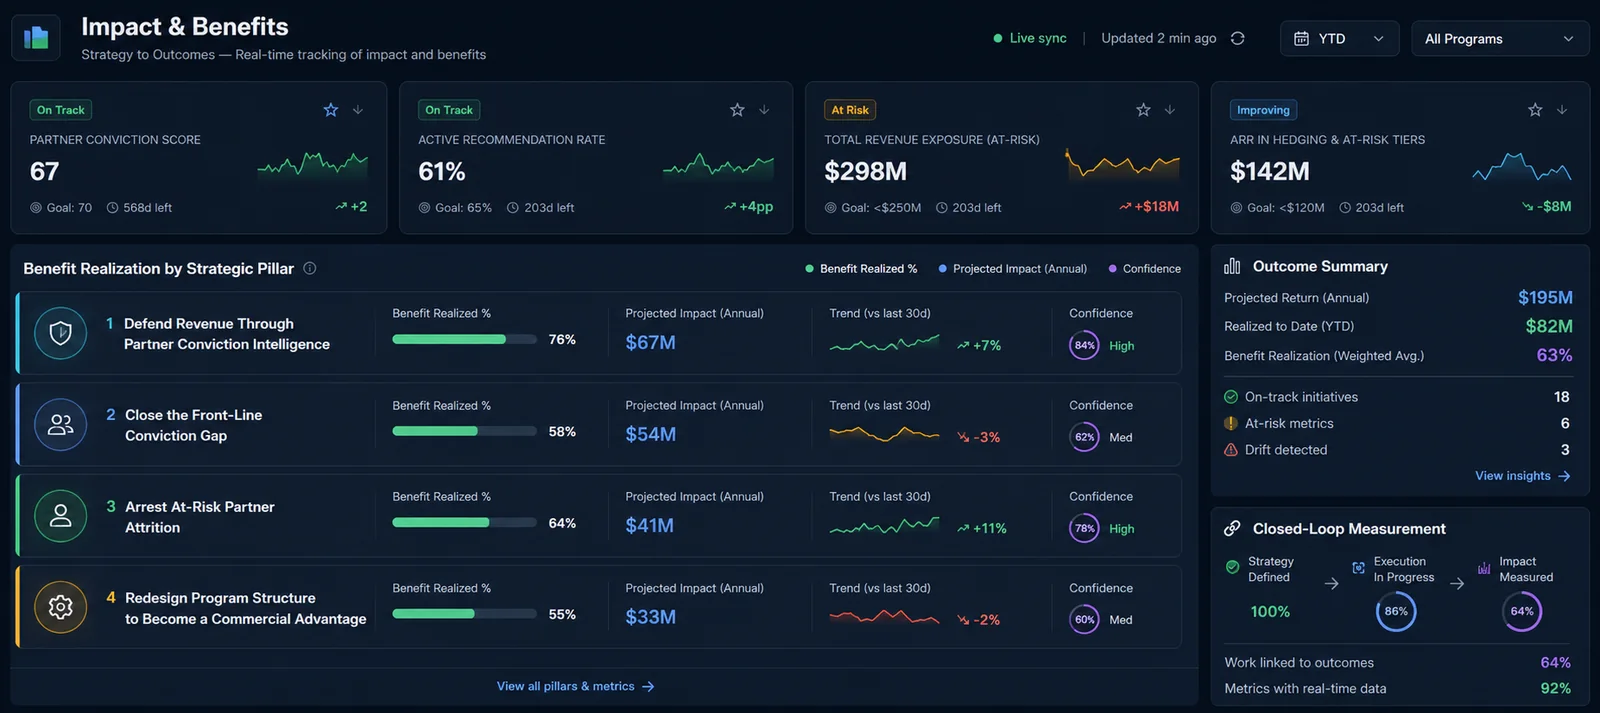
Iteright product view of an impact and benefits dashboard, tracking strategy to outcomes with drift detection
The outcome view: strategy to impact, read from live data instead of a hand-built summary. Product view, shown with demonstration data.
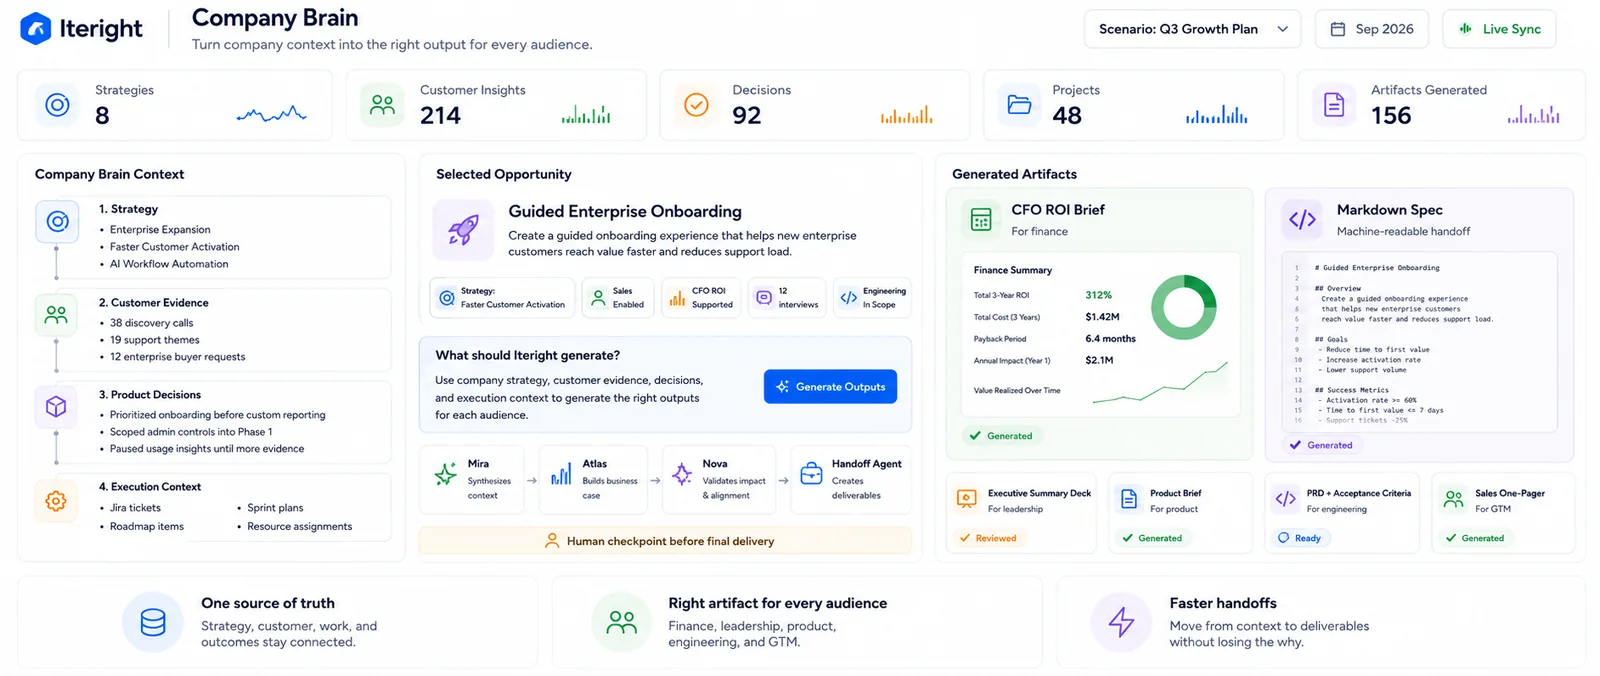
Iteright product view of a company brain, with strategy, customer evidence, decisions, and execution context connected in one place
Connected context: strategy, evidence, decisions, and execution held in one place, so the governance view has something true to read. Product view, shown with demonstration data.

The expansion pattern matters as much as the technology. One team proved the model against real data, and it is the proof, not a mandate, that is carrying the layer to the next nine teams.

Free. No Credit Card. No Prep. No Commitment.

Your Free Strategy Execution Snapshot.

Bring what you have. Leave with a clearer picture and a concrete plan.

Free.

No credit card · No prep · No commitment

Bring what you already have

Bring your roadmap, tickets, strategy notes, Jira or ADO export, Linear board, spreadsheet, or even a rough list of priorities. No cleanup, integrations, or long onboarding required — we do the work to turn what you already have into a clear picture of where effort is going, what is aligned, where things have drifted, and exactly what to do next.

  • Roadmap or strategy doc
  • Jira, ADO, or Linear export
  • Backlog or ticket list
  • ServiceNow demands
  • Spreadsheet or rough list of ideas

What you walk away with

  • Strategy-to-Execution Map

    See how goals, roadmap, initiatives, and active work connect.

  • Work Focus & Drift View

    Understand where effort is going and what may be drifting from the plan.

  • Opportunity Decision View

    Know what to build, pause, clarify, validate, or measure next.

  • Outcome & Next Moves Summary

    Get the outcomes, measurement gaps, and 3–5 recommended next moves.

Get your free Strategy Snapshot

Bring anything. We do the work. You'll leave with more clarity either way.

Used by VP Products, GMs, strategy leaders, and founders at companies from growth-stage startups to billion-dollar organizations.